Hello!
I've been using MotiveWave for a couple of years and love the program. From the start I've discovered a bug that I thought would be fixed with new updates. Unfortunately, two years later and the bug still hasn't been fixed. That is why I'm writing this today.
Here's the description of the bug. I like to use a lot of custom time frames or bar sizes with my chart analysis; 2 day, 4 day, 9 day, 17 day etc. Having this ability to set up chart with any bar size besides the traditional ones - 1 day, weekly and monthly is the main reason why I switched to MotiveWave. All of the different bar sizes work great except the 5 day bar size. The problem is specifically with a 5 day bar size, not a 1 week bar size. 1 week bar size uses a 7 days aggregation period and it works fine.
When viewing a chart in a 5 day bar size, all of the drawn objects disappear when you draw them or move them past the current bar in the empty future date of the chart. Drawn objects that are affected by this bug can be anything: a trendline, text, channel lines, horizontal lines, Fibonacci Retracement tool, etc.
Try this: Select a 5 day bar size chart. Now draw any object that uses a start point and an end point, like a diagonal trendline for example. Starting point of the trendline should be in the recent past date, and the endpoint of the trendline should be in the near future date. This bug will flatten the trendline (turn a diagonal line into horizontal line), and stretch the endpoint to infinity. No matter how much you scroll the chart into the future, you will not see the end point of your trendline.
This time draw another diagonal trendline that has both points (start point and an endpoint) in the recent past section of the chart. Now, drag the trendline to the right, all the way past the last bar, and drop it into the future date. The trendline will disappear. If you drop the trendline on the present date where the last bar is, the trendline will turn from diagonal to horizontal and the endpoint will be stretched to infinity date. And if you scroll the chart into the future date, this trendline will never end. This bug or type of behavior does not happen in other bar sizes other than 5 day when using drawn objects.
I've attached some screenshots to demonstrate the problem.
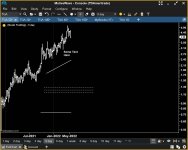
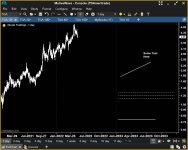
On a 5 day chart I've drawn some text close to the top. Below the text, I drew a diagonal line, below it a Fibonacci Retracement object, and finally a horizontal line. I've moved all these objects as far (or as close) as they will go to the last bar/present day before they start to disappear or distort.
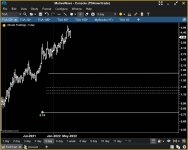
If I move objects any further to the right (even by 1 pixel), text will disappear, and other objects will become distorted. I moved the text just slightly to the right, and it disappeared. I moved the diagonal line slightly to the right, and it flattened (turned from diagonal to horizontal) and stretched to infinity. I moved the Fibonacci retracement object slightly to the right and it got distorted too. It stretched to infinity. I moved the horizontal line slightly to the right and it stretched to infinity. Now I moved all objects past the current date so that their starting point isn't in the past but future, and they all completely disappear from view.
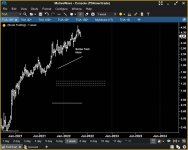
Without doing anything to the disappeared objects, I now switched the bar size from the problematic 5 day to a 1 week and all objects appeared correctly as they should be and where they should be. I switch bar size to 2 day and everything shows up fine.
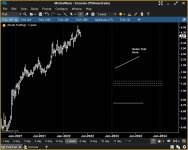
To demonstrate my point further, I moved all drawn objects far to the right (future date) and the 1 week bar size was able to display them correctly. A 1 day bar size is also able to handle and display the drawn objects correctly. In fact all bar sizes work fine. It's just the 5 day bar size that is problematic.
Most traders and technical analysts like to draw their objects on the charts past the last bar (present day) or in the future date section of the charts, in order to anticipate or predict stock price movements. The 5 day bar size time-frame prevents us from doing this correctly. Please address this bug. Once this bug is fixed, MotiveWave will be the greatest Charting software package on the market today.
Thank you for looking into this bug.
Vitali
I've been using MotiveWave for a couple of years and love the program. From the start I've discovered a bug that I thought would be fixed with new updates. Unfortunately, two years later and the bug still hasn't been fixed. That is why I'm writing this today.
Here's the description of the bug. I like to use a lot of custom time frames or bar sizes with my chart analysis; 2 day, 4 day, 9 day, 17 day etc. Having this ability to set up chart with any bar size besides the traditional ones - 1 day, weekly and monthly is the main reason why I switched to MotiveWave. All of the different bar sizes work great except the 5 day bar size. The problem is specifically with a 5 day bar size, not a 1 week bar size. 1 week bar size uses a 7 days aggregation period and it works fine.
When viewing a chart in a 5 day bar size, all of the drawn objects disappear when you draw them or move them past the current bar in the empty future date of the chart. Drawn objects that are affected by this bug can be anything: a trendline, text, channel lines, horizontal lines, Fibonacci Retracement tool, etc.
Try this: Select a 5 day bar size chart. Now draw any object that uses a start point and an end point, like a diagonal trendline for example. Starting point of the trendline should be in the recent past date, and the endpoint of the trendline should be in the near future date. This bug will flatten the trendline (turn a diagonal line into horizontal line), and stretch the endpoint to infinity. No matter how much you scroll the chart into the future, you will not see the end point of your trendline.
This time draw another diagonal trendline that has both points (start point and an endpoint) in the recent past section of the chart. Now, drag the trendline to the right, all the way past the last bar, and drop it into the future date. The trendline will disappear. If you drop the trendline on the present date where the last bar is, the trendline will turn from diagonal to horizontal and the endpoint will be stretched to infinity date. And if you scroll the chart into the future date, this trendline will never end. This bug or type of behavior does not happen in other bar sizes other than 5 day when using drawn objects.
I've attached some screenshots to demonstrate the problem.
On a 5 day chart I've drawn some text close to the top. Below the text, I drew a diagonal line, below it a Fibonacci Retracement object, and finally a horizontal line. I've moved all these objects as far (or as close) as they will go to the last bar/present day before they start to disappear or distort.
If I move objects any further to the right (even by 1 pixel), text will disappear, and other objects will become distorted. I moved the text just slightly to the right, and it disappeared. I moved the diagonal line slightly to the right, and it flattened (turned from diagonal to horizontal) and stretched to infinity. I moved the Fibonacci retracement object slightly to the right and it got distorted too. It stretched to infinity. I moved the horizontal line slightly to the right and it stretched to infinity. Now I moved all objects past the current date so that their starting point isn't in the past but future, and they all completely disappear from view.
Without doing anything to the disappeared objects, I now switched the bar size from the problematic 5 day to a 1 week and all objects appeared correctly as they should be and where they should be. I switch bar size to 2 day and everything shows up fine.
To demonstrate my point further, I moved all drawn objects far to the right (future date) and the 1 week bar size was able to display them correctly. A 1 day bar size is also able to handle and display the drawn objects correctly. In fact all bar sizes work fine. It's just the 5 day bar size that is problematic.
Most traders and technical analysts like to draw their objects on the charts past the last bar (present day) or in the future date section of the charts, in order to anticipate or predict stock price movements. The 5 day bar size time-frame prevents us from doing this correctly. Please address this bug. Once this bug is fixed, MotiveWave will be the greatest Charting software package on the market today.
Thank you for looking into this bug.
Vitali
Attachments
Last edited: