Hello my friends.
I have found something strange in motive wave compare with tradingview, which confuses me a lot.
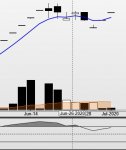
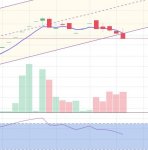
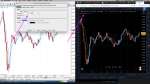
I have a chart opened in motivewave then opened in tradingview (the same chart), and I put EMA average on the chart and RSI.
BUT the view of the chart in each software is different !! I don't know why?!
even candlestick and volume look different. how should I analyze when there are two versions of the same chart. which one is correct? how to fix this?
just look at the picture and compare each part.
I have found something strange in motive wave compare with tradingview, which confuses me a lot.
I have a chart opened in motivewave then opened in tradingview (the same chart), and I put EMA average on the chart and RSI.
BUT the view of the chart in each software is different !! I don't know why?!
even candlestick and volume look different. how should I analyze when there are two versions of the same chart. which one is correct? how to fix this?
just look at the picture and compare each part.