Hi,
Feature Request: Add study values from a chart as horizontal lines to the DOM with an associated Study Label in the DOM Notes column
Perhaps this could be set up as using Right click on chart study>Add to DOM
The most recent study value would be displayed as a horizontal line and label running across all columns in the DOM and they would be auto updated in sync with the study on the chart.
Attached is a rough example picture.
Thanks!
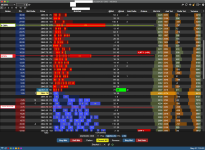