Unintuitive way templates work

treetoplake

Member
Joined
Jul 11, 2024
Posts
8
Likes
3
I have recently bought MW Order Flow .. i am going through the painful process of setting up what I want.
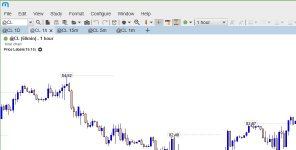
One screen with 1D, 60min, 15min (and TPO), 5min, 1min chrts tabbed.
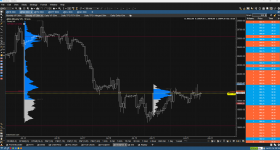
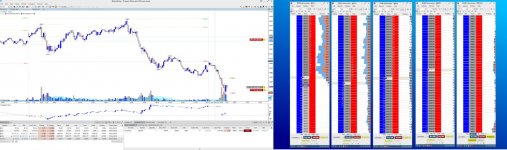
Other screen with some ladders. So far so good ... even the linking so I change instrument from the scasnner bottom left.
So far so good.

... except that I cant get templates to work for 1D charts or any of the charts. The templates are only local for each chart.
I want templates I can use on similar timeframes. Locically if the tabs are linked then changing in the scanner should change instruments and use settings of the charts .. but it doesnt.
Then I make a change and all the charts go to 1D or 1min .. and I'm back where I was 30minutes ago.
The ONLY way I can make progress is to make a backup each time I make some progress ... because to disable linking
for the 5 charts is about 5 clicks per chart and it seems unintuitive to have to do that.

... then try to make other changes and if it goes wrong .. restore from the latest backup.

The general setup looks intuitive .. and for the first few hours it all looks great .. until you try to get clever and use templates.
Venting because I'm annoyed .. grr.

Any ideas how to save a template from a chart to be the re-usable template at top level for any chart I choose? So I can have a 1D, 60min, 15min, 5min, 1min template that IS usable where I choose. At the moment the templates I thought I had made just dont work.
 

Attachments

  • WM.jpg
    WM.jpg
    208.8 KB · Views: 14
I am not sure what you are trying to achieve, but you might find this helpful.

Templates are good for Studies and their settings & that is pretty much it. If you want to save / tweak levels, boxes, lines, etc all of that stuff is handled by the "Analysis" or the analysis files...

Make sure that every chart is saved and named with it's own analysis. This is confusing, I know :( ; the analysis has NOTHING to do with the template - They are totally independent.

You can have multiple time frames running the same analysis which will allow you to draw a line on one chart and have it come up on the other... If 2 or more charts are using the same analysis file, you can customize what each chart displays by using the visibility option. IE - If you only want a VWAP on the 30 minute chart then set the visibility on that appropriately.

Hope that helps a little. I know your frustration, as I spent way too many hours trying to make sense of it all :)
 
I read many traders find the switch to MW or Sierra or InvestorRT, NT etc a bigger challenge than expected. I guess we just want to trade but we need to spend some hours customizing. Helps me to know I'm not the only one :) Thank you for sharing your insight earned by initial time investment into MW.

I'm trying to keep things simple. It sounds like I should be leaving templates alone for now.
My goal is to get MW setup and start trading as part of the course I'm doing. Analysis seems to be what I was looking for instead of templates.
And I will explore the use of the visibility thing. I'll be on it from Monday.

One more question. I have 5 timeframes tabbed and linked to the screener window for instrument change. Works well. Can I disable the x or close tab icon on all the tabs (typical windows thing I think)? Its so I don't accidentally close a tab in the heat of the moment. Once I have a working MW setup I want to 'fix it in stone' as it were and trade! Thanks for your help! :)
 
Okay since it does sound like it was the analysis vs. template thing that was making it difficult; Check out these other 2 posts (See links at the bottom) that you might find helpful. This is the best way to organize MW and not a lot of people take advantage of it. It takes a little time to set up, but it will make your life a lot easier in the long run.

As far as closing out the tabs by accident?? Well I do it myself once a week and have to re-open things :ROFLMAO: If there was a way to disable that, I would love to know - Perhaps someone else in here knows??

What I have gotten in the habit of doing and it has been a total lifesaver is this:

Every night before I shut down I manually backup my whole workspace... File > Backup and I save it with the current date as the name.

Worst case scenario in any situation you can always roll back to the way it looked the night before by simply doing a File > Restore.

Hope that helps - Here are the links:


Last edited:
Hi

Read your posts a couple of times and unfortunately I'm not there. Been trying again today with your help and Brian's help from MotiveWave.
Short version it's not working at all. Tried naming charts etc. Brian directed me to the MotiveWave videos (I watched some last week) but they are so niche and minutely detailed they miss the overview of basics.

Please can you write the simple steps to getting 5 instruments and 5 time-frame chart linked properly the MotiveWave way.
I need to add 2-3 studies on each chart that I can edit without everything else changing to 1min or loosing studies here or there.

I see you have tabs and sub-tabs. I only have tabs. Do I have to have sub-tabs?
Can I reuse a set of studies on other instruments and timeframes? Or do you have to redo it each time?
Also at what point do I save the chart name or analysis name etc?

Once I understand I will write it up in simple form with images for those coming after me. Thank you.
 

Attachments

  • tabs.JPG
    tabs.JPG
    41.4 KB · Views: 8
I will be honest I am not all that familiar with the linking function and how it works in MW. I have managed to get what I need by just using the visibility options...

I am sure there are several people here whom would be better equipped to help you if that is the road you need to go down.

Let me ask you this - Are these 5 charts / timeframes that you want linked together all going to be on the same screen??

In other words is the layout going to be like the red arrow, or are you going to have 1 chart per screen and get to the others with tabs like the green arrow?

1721754209128.png
 
Its the the green way I'm looking for. Almost full-screen charts on one screen with tabs at the top .. 1D, 60min, 15min, 5min, 1min for example to switch between. A few studies on each chart. I'm on the way to getting linking change instrument thing to work properly. But so far if I make changes to a study or try to use analyses or save chart .. it all goes to dust and back to the restore from file thing. I'd like to make some studies and be able to apply them to what ever chart I want without messing it all up again.
As a 2nd workaround, I'm thinking of just using their default setup on open. I just want to trade not change every little item of my setup.
Thank you for your patience with me.
Keeps me off the streets I guess.
 
Last edited:
Well if everything was going to be on the same screen, I would have been a better help because that is easily controlled with visibility. It sounds like you need someone who is more familiar with linking that I am. Perhaps @igor.s or @ScottyA might be able to assist??

In the meantime, have you tried toggling this to see if it has any positive effects on your situation?

1721756995929.png
 
Its the ghe green way I'm looking for. Almost full-screen charts on one screen with tabs at the top .. 1D, 60min, 15min, 5min, 1min for example to switch between. A few studies on each chart. I'm on the way to getting linking change instrument thing to work properly. But so far if I make changes to a study or try to use analyses or save chart .. it all goes to dust and back to the restore from file thing. I'd like to make some studies and be able to apply them to what ever chart I want without messing it all up again.
As a 2nd workaround, I'm thinking of just using their default setup on open. I just want to trade not change every little item of my setup.
Thank you for your patience with me.
Keeps me off the streets I guess.
For the studies you want to use, make a template for the studies. Than open a chart with a instrument and make different analysis (sub-tabs) for the timeframes. Apply your templates on the different analysis sub-tabs and name the analysis sub-tabs. Something like this.
 

Attachments

  • Skärmbild 2024-07-23 203942.png
    Skärmbild 2024-07-23 203942.png
    148 KB · Views: 27
Thanks for the tip .. I have that setup now as you say with sub-tabs and templates being used properly.
Right click rename and the suffix is the chosen time-frame. Seems to make some sense now.
Also the open folder icon after the sub-tabs .. wowo it enable re-open accidentally closed tabs. I'm beginning to like the way its organized.
Querky but it works. Thank you for your help.
 
Top