Volume Imprint - error calculating summary delta profile

Vlad

Well-known member
Joined
Aug 15, 2024
Posts
73
Likes
24
1725027264041.png
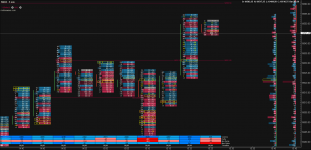
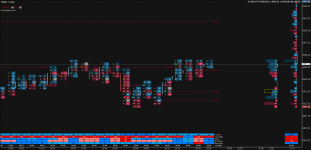
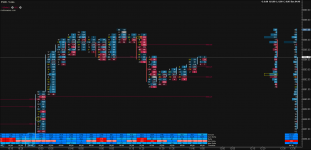
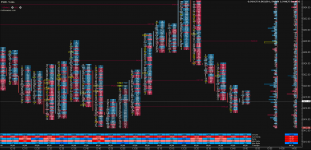
I use footprint with summary table, and summary profile configured to show the delta. With time, the cumulative delta in the summary profile diverges from bar-based delta - 734 vs -873 in the screenshot. The summary profile resets once I flip extended hours on and off. Unless someone can provide a reasonable explanation for the behavior, this got to be a bug in the summary profile calculation.
 
This screenshot shows summarized delta at every price on the bar and its the same as the Delta totals in the lower table.
 

Attachments

  • NQU4 - Untitled - Aug-30 2126 PM (5 min).png
    NQU4 - Untitled - Aug-30 2126 PM (5 min).png
    240.5 KB · Views: 13
Let me clarify. I just reopened todays ES after close, RTH only, and cumulative delta under the last candle (bottom left) equals cumulative delta under the summary profile on the right (bottom right), both showing 11,732. This is as expected. In realtime during the day however, these two values always begin to diverge (see my earlier screenshot), which I can attribute to nothing but a bug in summary profile calculation. This is frustrating as I can't trust the totals under the summary profile, but I need to. I have to continuously reset the summary by flipping RTH on and off as a workaround.

1725058067282.png
 
Ok my bad its Cum Delta you talking about I thought it was just Delta. In your first screenshot Cum delta is +734 on the bar not -734. So the difference is sizable. I cant replicate it now after the market close. Are you sure about the bar settings and the Summary settings are same.
 
Well, there isn't much in the config to cause difference in calculation. The only thing in Summary Profile i see is Time Span, which is default to Day in my case, so with only showing RTH I don't see why they'd diverge:
1725113478915.png
 
Market has only been open for a couple hours, but its showing the right values on my chart so far.

What market data do you use?

Updated with end of day on a 5 min chart. Looks perfect to me.
 

Attachments

  • ESU4 - Untitled - Sep-02 0237 AM (5 min).png
    ESU4 - Untitled - Sep-02 0237 AM (5 min).png
    114.6 KB · Views: 10
  • ESU4 - Untitled - Sep-02 1750 PM (5 min).png
    ESU4 - Untitled - Sep-02 1750 PM (5 min).png
    141.2 KB · Views: 7
Last edited:
I'm on rithmic. This week it's been completely off, even after switching extended hours display. I'll reach out to support at some point.
 
Just took another screenshot of my ES chart. It looks perfect. How about your Rithmic settings do you have aggregated on/off?
 

Attachments

  • ESU4 - Untitled - Sep-06 1945 PM (5 min).png
    ESU4 - Untitled - Sep-06 1945 PM (5 min).png
    357.1 KB · Views: 6
No, I never aggregate, and connect directly as opposed to via r trader. Must be something with my footprint setup that messes the calculation logic up
 
Top