15min candles to the right of 5min candles on the same chart?

vonhale

Member
Joined
Aug 7, 2023
Posts
8
Likes
1
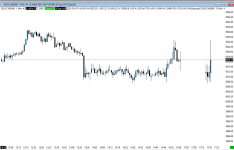
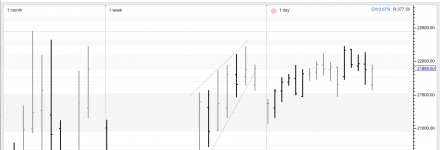
Hello. Is there any way to put a set of candles of a different timeframe to the right of the main chart? I can do a summary candle with the volume imprint but it's a single candle and daily is the smallest timeframe. Here is an example of what i'm looking for. Thanks in advance.
 

Attachments

  • Gt-jjeyWwAAQFck.png
    Gt-jjeyWwAAQFck.png
    157 KB · Views: 19
This might not be what you are looking for, but I think its the closest you can come to what you want to achive.

Skärmbild 2025-06-22 195151.png
 
This might not be what you are looking for, but I think its the closest you can come to what you want to achive.

View attachment 2973
This is how I also have mine setup to achieve similar goal. I added a small chart next to my main one that I wanted and just hided the “price latter axis to give it a bit more of a streamlined feel.

I know Sierra Chart offers that particular feature but since I mainly use MotiveWave on my Mac this is how I was able to achieve kind of similar result as well!

Best Regards
 
Similar approach. I wish the MW supported a feature to hide the price axis. Until than I overlap it with the next chart window.
 

Attachments

  • Screenshot 2025-06-23 at 5.08.56 AM.png
    Screenshot 2025-06-23 at 5.08.56 AM.png
    94.1 KB · Views: 9
  • Like
Reactions: GAi
Similar approach. I wish the MW supported a feature to hide the price axis. Until than I overlap it with the next chart window.
Hi Igor!
I personally have now fully migrated to MW Version 7.0B7 and this particular feature is actually available, the ability to Hide the Price Axis for a respective chart!

Right -click on the the specific chart -> Chart Settings-> Display-> uncheck “Show Price Axis”
And you all set!!

Below is a screenshot showing how just in case!

Best Regard
 

Attachments

  • Screenshot 2025-06-23 at 9.23.50 AM.jpeg
    Screenshot 2025-06-23 at 9.23.50 AM.jpeg
    70.8 KB · Views: 12
Hi Igor!
I personally have now fully migrated to MW Version 7.0B7 and this particular feature is actually available, the ability to Hide the Price Axis for a respective chart!

Right -click on the the specific chart -> Chart Settings-> Display-> uncheck “Show Price Axis”
And you all set!!

Below is a screenshot showing how just in case!

Best Regard
Thank you!

Good to know.

cheers.
 
  • Like
Reactions: GAi
Top