Accuracy/Calculation of Point & Figure

Az01

Member
Joined
Jul 24, 2021
Posts
13
Likes
2
Hi,

I have contacted about this via email, I am hoping between members and support we can find a solution.

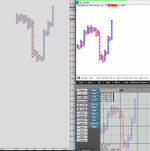
The point and figure created on MW does not seem to match what I get with Sierra Chart and CQG Integrated Client or CQG Qtrader. Both Sierra and CQG IC match but MW is quite different and the amount of X/Os and reversals are off.

I have tried CQG and Rithmic data on Sierra and both matches. I have tried CQG, Rithmic, and dxFeed on MW and non of them seem to recreate what I see on Sierra or CQG IC.

Any help please?
 
Last edited:
Screenshot attached
 

Attachments

  • Screenshot 2021-07-24 at 13.26.59.png
    Screenshot 2021-07-24 at 13.26.59.png
    590.8 KB · Views: 32
Could be a difference in the settings between the platforms.

checks for the following:
Input: Ticks/Minutes
Session: reset/no reset
Type: High-Low / Close only. MW supports only High/Low type. I did submit a request to MW team to add support for Close only type as well.

I use P&F charts all the time. I trade NQ mostly. The MW implementation works for me well. I haven't tried to match other platforms though. It is not critical for me.

Cheers.
 
Thanks @igor.s, appreciate the reply.

I have done the checks on those already and matched everything except the ‘type’. There isn’t an option for it on the other 2 platforms or on MW that I can see for P&F.

The picture is as close as I can get it.

I am not trying to match it for the sake of matching. My mentor who has been trading for over 50 years using P&F charts on and off the floor uses CQG IC, and I am just trying to see what he sees for reversals. I’ve been using Sierra charts and that was matching his. I’ve just had enough of Sierras constant push towards their data service. Plus I use a Mac!
 
I recommend to look at the reversal bars which are similar to P&F but you would see wicks. That would help you to spot reversals ahead of the P&F and fine tune entries/exits.

cheers.
 
Can you share an example please?

Its not so much that I am looking to get in a reversal quicker. It’s where the reversal levels are that’s more important.

I am using multiple variations of P&F to confirm tops or reversals. Not necessarily trying to get in them quicker
 
HI Guys

why everything here does not show for all data? it is showing just for a few days ? am i missing any settings here?

1627173926194.png
thanks
 
I follow Point and Figure for long time and compare Ninjatrader, MW and sierrachart and Quantower as well. The problem here is wrong when print a new X or O, The clasic manual Dorsey and others explain you cant print a new X or O until new box is filled with the price up or down, but in MW a new box is printed with price only is moving few tick above or bellow the high or the low of the previus boxes, if the price back the new box created still be there and is not real. This create false high and low and false reversal.
 
The MW uses high/low logic instead of close only. Some time ago I submitted a request to add support for close only as well. Depending on your trading strategy both logics serves their purpose.

cheers.
 
Yes that be possible, but a new box cant be printed on the chart UNTIL all box size is take. At least like NT they print when the the price is moving more than 50% of the box size
 
Last edited:
I recommend to send an email to support so they would have more evidence of interest. The more clients asks about that feature the better. In the meantime you may set an extra chart, next to your P&F, using Renko with the wicks turned off and the box size adjusted to match the P&F.

@MotiveWave_Jason, @MotiveWave_Joe

cheers.
 
Top