Automatically add/remove weekly and daily naked point of control (POC)

Terd

Member
Joined
Jun 18, 2024
Posts
12
Likes
2
Fairly new user here.

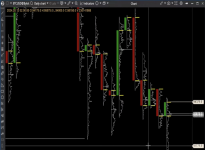
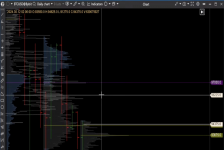
I'm currently using ATAS with a template that I need to reload to see my daily NPOC:s. So I was wondering if anyone here know if this is possible to achieve this with maybe Volume Imprints or something else in Motive Wave? I want it to update automatically every day so that the daily and weekly NPOC:s that have been touched is removed and new ones added.

Sorry for asking maybe an obvious questions but Motive Wave is very complex and its hard to get a grasp on all of the possibilities.

The picture attached is how it looks currently in ATAS
 

Attachments

  • Screenshot 2025-01-08 at 21.49.49.png
    Screenshot 2025-01-08 at 21.49.49.png
    426.1 KB · Views: 17
  • Screenshot 2025-01-08 at 21.51.12.png
    Screenshot 2025-01-08 at 21.51.12.png
    682.5 KB · Views: 16
This image below is the Volume Imprint study. Each profile represents one day session. The red lines are POCs, & NPOCs that will continue to draw until they are touched.

1736375237456.png

The NPOC option is actually under the display tab of the Volume Imprint study.

1736375058852.png

Assuming that is what you are looking for, I will add the template as an attachment here. I have to add it as a .zip file because of the attachment rules here, so be sure to unzip it.

Also - load this on a DAILY time frame to achieve what you see as notated in the screen shot above.

Hope that helps!
 

Attachments

Last edited:
Also - Just in case anyone needs help getting a template imported:


* Right click on an empty spot on the chart
* Select Template > Manage Template
* When the new window pops up select "Import"
* Point it to the file above (Make you unzip it - I could not attach a .TML file here)


The template should now be in your list of templates....

To apply it just right click on an empty space on the chart and select templates & you will see it listed.
 
Amazing, thank you so much!

And if I want both the weekly and daily (and maybe monthly) to be visible at the same time on the same chart, I create additional studies but with different times on that chart?
 
You would not be able to use the same Volume Imprint study since the timeframe will be set to "Daily" on the chart settings.

You could probably add the TPO study and hide everything (Make the colors totally transparent) but the NPOC.

Just be warned, if you are looking for a monthly POC the software has to literally process every single tick for a month which is an incredible amount of data. Loading that up every day will take some time. You might want to think about having the software calculate it once to see where it is located and then just hand draw it in :) Or you could pick "Use Historical Bars" on the general tab - This will calculate things a lot faster but it is just an "estimation" so more than likely the POC will not be correct.

On the TPO study you choose the timeframe on the first tab & the NPOC is located here.

1736426571400.png
 
Top