Chart sync question....?

ProfileGuy

Active member
Joined
Apr 13, 2023
Posts
37
Likes
12
Hi

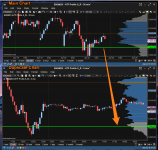
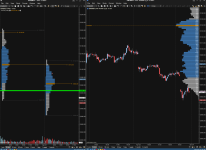
I have two analysis charts opened and they're linked together so when I add guides or remove studies it occurs on both.
I'm wondering how I can alter the connection so one chart is the parent and the second chart serves as the child.
Example:

With the top chart being the higher time frame, I'd like to add guides to the chart and have those guides reflect on the smaller time frame chart below.
But I Don't want the "child chart" to alter or affect the "parent chart" in anyway. Is this possible with Motivewave?
 

Attachments

  • image.png
    image.png
    563.1 KB · Views: 50
I'm wondering how I can alter the connection so one chart is the parent and the second chart serves as the child.

The way I've dealt with this (keeping everything on one chart and not split up over different MotiveWave analysis files) is by leveraging the Visibility of unique tools and Studies. In that way, What happens on higher, slower timeframes, I can separate from what happens on lower, faster timeframes.

Take an example from my current setup: I like having the daily 50 and 200 SMA's show up on time frames 1h and slower/higher. I have the daily VWAP set for 1hr and all TF's and faster/below. Whenever I add a guide to display an entry, I configure it's Visibility to show up on all TFs.

Hope that's helpful for how you might be able to accomplish what you're wanting. I'm curious to read how others achieve the same.
 
Thanks Scotty,
I need floating windows/analysis
Because I’m using different charts like TPO too, and so I need guides from different windows to transfer over to my trigger chart where I take trades on. Other platforms support this idea…I would be surprised if motive wave does not support this
 
I need floating windows/analysis
Because I’m using different charts like TPO too, and so I need guides from different windows to transfer over to my trigger chart where I take trades on.

You're unintentionally conflating two separate things: Windows/Charts and MotiveWave Analysis Files.

MotiveWave organizes files (not charts or window) differently than many platforms. Where other platforms have Studies/indicators unique to a chart, MotiveWave assigns Studies to Analysis Files, not to a chart. Meaning, I can have one Analysis File AND display that on as many different charts/windows I want.

Take my actual setup for example:

Screenshot 2023-04-23 at 4.20.09 PM.png

I have 5 different floating charts/windows for ES that are all from the same Analysis File called, (Primary Analysis). So whatever I add to one of them will show up on the others, but in the way that they are different, I manage through Visibility. The easiest to recognize are the Volume Study guides on each respective timeframe.

The Charts/Windows are also all linked, which means that if I changed the instrument, each Chart/Window would update to the new symbol.

Again, this is just one way to do what you're wanting, while I recognize it may not be the right solution for you. Just want to help explain the flexibility of MotiveWave.
 
Thanks Scotty,

You mentioned "VISIBILITY" I've tried using Object viewer but it seems to affect both....
Are there other ways other than using Analysis files to linked them up

I really just want drawings to be shared amongst different charts

Update: I found the visibility option under study settings

Can I share drawings amongst these windows in the new photo i posted?
 

Attachments

  • 5555.png
    5555.png
    686.1 KB · Views: 31
Last edited:
Can I share drawings amongst these windows in the new photo i posted?

The short answer is "no" to sharing your new photo. The reason is that you're using two separate Analysis Files. One of them is called, TPO, and the other is called, HTF Profile S_R. As I understand Analysis Files, you cannot share anything over differing Analysis Files.

The way I suggested may not be the right option for you if what you're wanting is to use the same timeframe on both charts. My solution was predicated on you having different timeframes. Just like @itradefutures describes above, it requires the SAME Analysis File but DIFFERENT timeframes.

Another option to have different Analysis Files on the same timeframe might be to incorporate a 2nd data provider. This isn't ideal, but it is an option.
 
Thanks guys, I guess I'll deal with the hacks for now.
Sierra charts has it where each chart is assigned a number. So your child chart with all the shared drawings on it would be sharing a link with chart #5, #6,#10 etc...
 
Sierra charts has it where each chart is assigned a number. So your child chart with all the shared drawings on it would be sharing a link with chart #5, #6,#10 etc...

SC is a beast of charting platforms! Great stuff there.

Like @itradefutures mentioned, that chart-sharing feature may be in a future release.
 
Thanks guys, I guess I'll deal with the hacks for now.
Sierra charts has it where each chart is assigned a number. So your child chart with all the shared drawings on it would be sharing a link with chart #5, #6,#10 etc...
I really hope motivewave can pull something off something similar
 
Following this, I hope there is a better solution in the future. ??
 
Any update on a release with this? This seems to be a very basic capability that is available in most other platforms I have tried/used.
 
I also need an update on this? I'm thinking of switching to Sierra for just this reason.
 
Top