Spin
Well-known member
- Joined
- May 22, 2019
- Posts
- 515
- Likes
- 226
Hello fellow MW-coders ")
Another issue is puzzling me. I am working on a Study that follows this logic:
I have used the general layout above before in other Studies, and had no complaints so far.
But this Study is not playing nice: if I drop it on a chart and let it run (whether on a 'live acccount' during trading hours or by making use of the 'Replay'-function), it refuses to 'clear' all figures sometimes.
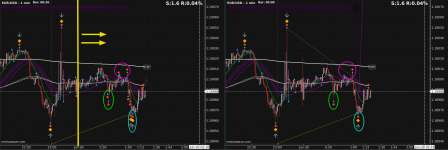
I see markers plotted above or below certain bars, and when the values of the next bar reach certain levels they should be removed onBarUpdate, and re-plotted on the current bar, but this not always happens, as you can see in the screenshot below:

FYI: I dropped the Study on the leftmost chart when it was at the yellow vertical line, and let it run on Replay. And on the chart on the right hand, I dropped that exact same Study at the current bar.
Why do some markers stay on the charts, even though I effectively erase all Figures on every 'BarUpdate' ??

Has anyone experienced similar behavior before ? Did you get it fixed ? How ?
Thanks for all input !
Another issue is puzzling me. I am working on a Study that follows this logic:
Java:
onBarUpdate{
    calculateValues
}


calculateValues{
    clearFigures
    perform the calculations in 'Z' and draw Markers
    calculate
}

Z{
    check stuff
}

calculate{
    check signals + create secondary plots
}
I have used the general layout above before in other Studies, and had no complaints so far.
But this Study is not playing nice: if I drop it on a chart and let it run (whether on a 'live acccount' during trading hours or by making use of the 'Replay'-function), it refuses to 'clear' all figures sometimes.
I see markers plotted above or below certain bars, and when the values of the next bar reach certain levels they should be removed onBarUpdate, and re-plotted on the current bar, but this not always happens, as you can see in the screenshot below:
FYI: I dropped the Study on the leftmost chart when it was at the yellow vertical line, and let it run on Replay. And on the chart on the right hand, I dropped that exact same Study at the current bar.
Why do some markers stay on the charts, even though I effectively erase all Figures on every 'BarUpdate' ??
Has anyone experienced similar behavior before ? Did you get it fixed ? How ?
Thanks for all input !
Attachments
Last edited:


") )
)