Hi good folks,
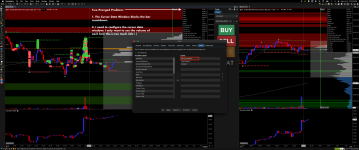
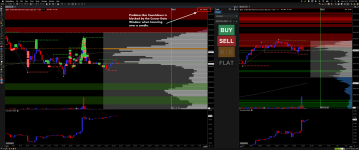
Is there a way to designate what info appears when the Cursor Data Window is activated? Presently it shows far more data than I want to see; moreover, the large window blocks much of the current candle action, making it difficult to conduct proper analysis. It also blocks the bar countdown.
Alternatively, is it possible to otherwise place the volume of the candle somewhere on the screen, similar to the way the bar countdown, range, and spread is pictured in the attached?
Many thanks in advance for your guidance!
")
")