Custom Study Based on Opening Range?

h3o

Member
Joined
Jul 4, 2024
Posts
5
Likes
1
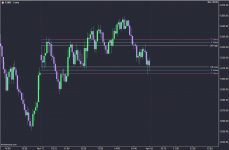
Wondering if anyone has created or knows how to create a custom study that would work with Fisher's ACD method? Essentially would just need a few levels drawn:

- Opening range high
- Opening range low
- Opening range mid (optional)
- A value: x amount of ticks above/below opening range high/low
- C value: x amount of ticks above/below opening range high/low

Basically just need an indicator that can plot horizontal lines based on the above. The A and C values should each have a user input to enter the amount of ticks that the levels should be drawn above/below the OR. And the OR should have a user input to select the time (ie. 15 mins). Would also be nice to have an option to plot based on RTH data.

Attached is a screenshot to better visualize the ask.
 

Attachments

  • MW ACD Example.png
    MW ACD Example.png
    33.2 KB · Views: 21
Take a look at the OHLC study, it draws the open range lines based on the selected time, 5m is default.

cheers
 
  • Like
Reactions: h3o
Take a look at the OHLC study, it draws the open range lines based on the selected time, 5m is default.

cheers

Thanks, yes that study has a great built-in OR. Would just need to figure out how to add A value and C value levels/inputs to it. Was hoping someone else might have already tried to create something similar or could give some pointers as I'm not familiar with java/SDK :/
 
I was looking for something similar - to be able to specify A value and C value, preferably
3 levels on each side up and down based on percentage of the opening range - ability to customize A1 A2 A3 (above targets) and C1 C2 and C3 (below targets). Options like plot A1 at 30% and A2 at 70% and A3 at 100% of the opening range. Same for downside.
Also shade the area of the range it self, and provide the values into the cursor data window .
 
Thanks, yes that study has a great built-in OR. Would just need to figure out how to add A value and C value levels/inputs to it. Was hoping someone else might have already tried to create something similar or could give some pointers as I'm not familiar with java/SDK :/

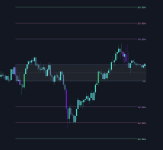
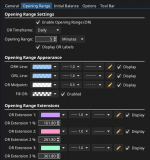
I built this upon request from a trader. It's available here for anyone who is interested.

You can set the extended levels to a custom percentage-based target.

Screenshot_20250601_095242.png

Screenshot_20250601_095613.png
 
I built this upon request from a trader. It's available here for anyone who is interested.

You can set the extended levels to a custom percentage-based target.

Thanks for sharing. I was looking for something exactly like this but instead of putting a % as the extensions, I want to be able to set tick values. ie.

- OR Extension 1: 10 ticks
- OR Extension 2: 16 ticks
 
Thanks for sharing. I was looking for something exactly like this but instead of putting a % as the extensions, I want to be able to set tick values. ie.

- OR Extension 1: 10 ticks
- OR Extension 2: 16 ticks
Noted. I can add a setting for this in an update so that you can set it to ticks instead of percentage.

It might take a few days before I get the time to do it, but I'll let you know when it's released.
 
  • Like
Reactions: h3o
Thanks for sharing. I was looking for something exactly like this but instead of putting a % as the extensions, I want to be able to set tick values. ie.

- OR Extension 1: 10 ticks
- OR Extension 2: 16 ticks

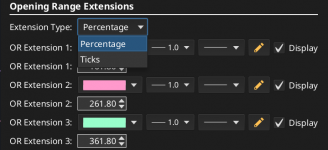
I have updated the study, it now has a setting to choose between percentage or tick number for extended targets.
https://tradingtools.dev/opening-range

If you want to display labels like A, B etc you can add them as a tag in path settings.

Screenshot_20250606_130637.png
 
  • Like
Reactions: h3o
Top