Wondering if anyone has created or knows how to create a custom study that would work with Fisher's ACD method? Essentially would just need a few levels drawn:
- Opening range high
- Opening range low
- Opening range mid (optional)
- A value: x amount of ticks above/below opening range high/low
- C value: x amount of ticks above/below opening range high/low
Basically just need an indicator that can plot horizontal lines based on the above. The A and C values should each have a user input to enter the amount of ticks that the levels should be drawn above/below the OR. And the OR should have a user input to select the time (ie. 15 mins). Would also be nice to have an option to plot based on RTH data.
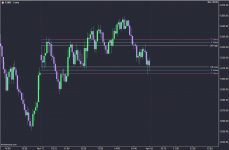
Attached is a screenshot to better visualize the ask.
- Opening range high
- Opening range low
- Opening range mid (optional)
- A value: x amount of ticks above/below opening range high/low
- C value: x amount of ticks above/below opening range high/low
Basically just need an indicator that can plot horizontal lines based on the above. The A and C values should each have a user input to enter the amount of ticks that the levels should be drawn above/below the OR. And the OR should have a user input to select the time (ie. 15 mins). Would also be nice to have an option to plot based on RTH data.
Attached is a screenshot to better visualize the ask.