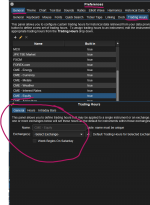
Display current day's range on chart

Donovan2580

Well-known member
Joined
Sep 13, 2020
Posts
558
Likes
308
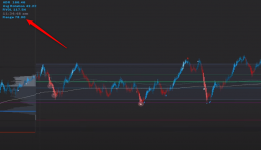
Does anyone know of a way to display the current day's range on the chart with just simple text numbers??

Here is a screenshot of Sierra Chart for example showing what I am talking about. I am constantly using the measurement tool to calculate the days range and it would be nice to just have it up there in the corner like that.

1689862773697.png
 
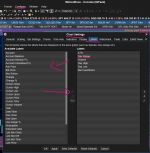
go to preferences or just double click on the chart ( if you want it on all your charts use preferences & save a as default) labels, select it & move it over to the right column. You can go into the settings by double clicking on it & choose color & where you want it displayed etc.
1689869287523.png
 
go to preferences or just double click on the chart ( if you want it on all your charts use preferences & save a as default) labels, select it & move it over to the right column. You can go into the settings by double clicking on it & choose color & where you want it displayed etc.

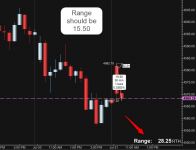
Quick question: Perhaps I am missing something obvious - Is there a way to show just the RTH session??

When I put on the range it is including the overnight range whether or not I toggle "Show extended data" on/off.

The chart below is just after the first 30 minute bar completed (10:10 a.m. Eastern Standard Time) w/ETH data switched off.

Thanks!!

1689948285121.png
 
Last edited:
honestly idk how to do that. you might have to mess around with the exchange time settings in preferences. but i would email support as they can probably direct you better. 1689969147842.png
 
Top