"EdgePro Line" TYPE Indicator for Motive Wave

Ghome

Well-known member
Joined
Mar 29, 2023
Posts
129
Likes
34
Is there an indicator for MotiveWave that is similar to the EdgePro X indicator called EdgePro Line? I would rather purchase MotiveWave outright than have to stay on a subscription-based plan but I do like the indicator that EdgePro X has and I am wondering if something like that exists for MotiveWave. The indicator does the following.

The EdgePro Line is a theoretical average when you place trades. This indicator shows the theoretical breakeven point as you add or remove positions.
 
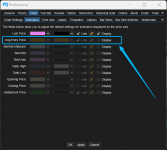
I think I am understanding your question correctly... I believe this is close to what you are looking for.

While it will not draw any historical lines on the chart, it will generate a line showing you the average (Or Break Even) of your position.


1681765466726.png
 
I think I am understanding your question correctly... I believe this is close to what you are looking for.

While it will not draw any historical lines on the chart, it will generate a line showing you the average (Or Break Even) of your position.


View attachment 1663
Oh wow well, that is amazing to know. And the line will adjust while adding or removing my position size?

The link below shows a quick video of what their EdgePro Line tool does it's the first video top left. If that helps give more clarity. But what you are sharing sounds pretty great.

 
Last edited:
It will just display a line where your average price / break even is.

It will adjust itself as you scale in or out, it just won't show the "history" like the yellow one in that video


1681808347390.png
 
Top