Hi everyone,
I recently decided to buy the Order Flow edition of MotiveWave and I’m absolutely loving it so far—but there’s one thing I just can’t figure out, and I think only you might be able to help me.")
Really struggling with templates and cross-chart trendlines
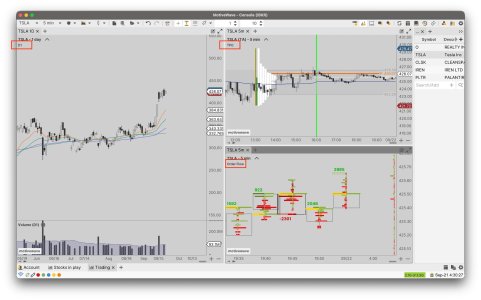
screen 1.jpg – I have three charts: one D1 and two M5.
On the D1 chart I placed a few random moving averages and saved that as template “D1”.
On the first M5 I have a TPO and session Volume Profile, saved as template “TPO”.
On the second M5 I have a Volume Imprint and VWAP, saved as template “Order Flow”.
I linked all three charts together so when I change a ticker in the watchlist every chart updates perfectly. Great so far.
Now comes my wild dream: I would like to draw a trendline on the D1 and have it visible on the M5 charts.
I know this is not as simple as in many other platforms—I have already read dozens of forum posts on the subject.
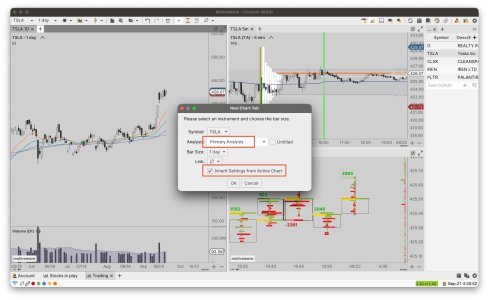
screen 2.jpg – I add a new chart on D1, enable “Primary Analysis” and check “Inherit Settings” so the moving averages from my D1 template appear automatically.
Of course, they do not appear. Fine, I think, I will just apply the template afterward.
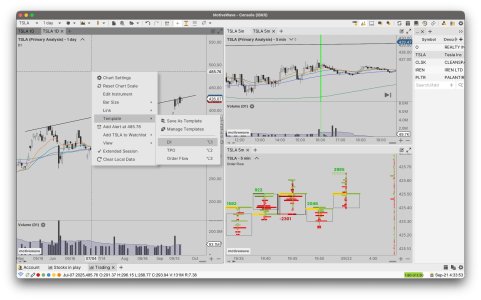
screen 3.jpg – Let’s test this on a single M5 chart: I add Primary Analysis and draw a trendline to see if it syncs. It works! Half the battle won.
Next step: re-apply the templates on both “Primary Analysis” layers.
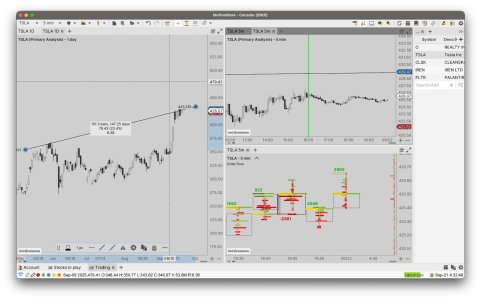
I add my D1 template (with moving averages) on the D1 chart and… those averages also show up on the M5 (screen 4.jpg).
This basically means templates are not acting like templates.
Yes, I know I can go into the Object Editor and change Visibility for every single item, but doing that for every symbol and every moving average takes a huge amount of time.
So my questions are:
The software is absolutely brilliant, but limitations like this make me spend hours configuring instead of actually trading.
Thanks in advance for any advice!
I recently decided to buy the Order Flow edition of MotiveWave and I’m absolutely loving it so far—but there’s one thing I just can’t figure out, and I think only you might be able to help me.
Really struggling with templates and cross-chart trendlines
screen 1.jpg – I have three charts: one D1 and two M5.
On the D1 chart I placed a few random moving averages and saved that as template “D1”.
On the first M5 I have a TPO and session Volume Profile, saved as template “TPO”.
On the second M5 I have a Volume Imprint and VWAP, saved as template “Order Flow”.
I linked all three charts together so when I change a ticker in the watchlist every chart updates perfectly. Great so far.
Now comes my wild dream: I would like to draw a trendline on the D1 and have it visible on the M5 charts.
I know this is not as simple as in many other platforms—I have already read dozens of forum posts on the subject.
screen 2.jpg – I add a new chart on D1, enable “Primary Analysis” and check “Inherit Settings” so the moving averages from my D1 template appear automatically.
Of course, they do not appear. Fine, I think, I will just apply the template afterward.
screen 3.jpg – Let’s test this on a single M5 chart: I add Primary Analysis and draw a trendline to see if it syncs. It works! Half the battle won.
Next step: re-apply the templates on both “Primary Analysis” layers.
I add my D1 template (with moving averages) on the D1 chart and… those averages also show up on the M5 (screen 4.jpg).
This basically means templates are not acting like templates.
Yes, I know I can go into the Object Editor and change Visibility for every single item, but doing that for every symbol and every moving average takes a huge amount of time.
So my questions are:
- Is manually adjusting visibility for each study really the only option?
- Is there any setting like “template visibility on [specific chart]” that I’m missing?
- How do you deal with this in practice?
The software is absolutely brilliant, but limitations like this make me spend hours configuring instead of actually trading.
Thanks in advance for any advice!