Matching NPOC with Atas

Terd

Member
Joined
Jun 18, 2024
Posts
12
Likes
2
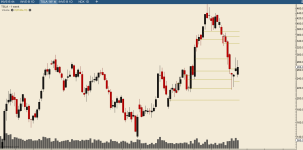
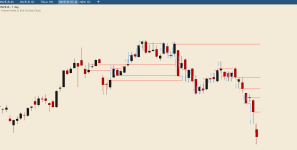
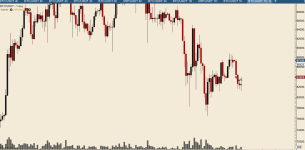
I have been trying to match the data points on Atas with Motive Wave. I know it will not be exactly the same because of different data providers, but does anyone know what settings in Motive Wave would be as close as possible to getting these NPOC:s that I have in my screenshot?

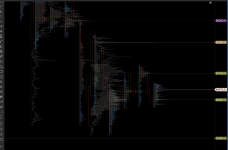
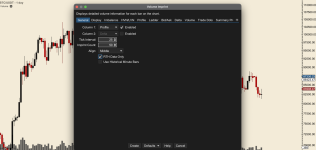
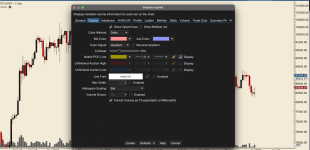
Im assuming this would be done with Volume Imprint?, but I cant seem to get the settings right to get the naked points of control close to/the same as in the screenshot.

The NPOC:s in the screenshot is on Bitcoin (BTC) and the yellow are weekly and purple are monthly.
 

Attachments

  • Screenshot 2025-04-02 at 09.37.12.png
    Screenshot 2025-04-02 at 09.37.12.png
    267.8 KB · Views: 14
Yup - It will be Volume Imprint. Right here:

1743617477568.png

I will attach a template that should work for you. Here is what it looks like applied to NQ. The Red lines are NPoc's.

Capture.PNG

I am guessing with BTC you might need to increase this (Tick Size) on the first page of the settings... You might even need to go as high as 10 or 25, I am not sure. I don't have a feed with BTC data so I cannot test it.

1743617710911.png

Attached is a template (I had to zip it to be able to attach it).... It was designed to have every Volume Profile represent "1 day" - So make sure to set your MotiveWave chart to 1 day after you load it.
 

Attachments

Thanks a bunch for the reply!

The problem is that when I follow your steps, this happens:

So the first and the second picture is my settings, which is exactly like yours. When I then create the study it looks like this on the third picture. I only get two very small lines at the very right on the chart (the third candle from the right, its easy to miss since its so small).

When I load your template it looks like this on the final picture, just one super small red line and three small clusters of imprint orders.
 

Attachments

  • Screenshot 2025-04-02 at 21.51.10.png
    Screenshot 2025-04-02 at 21.51.10.png
    554.2 KB · Views: 4
  • Screenshot 2025-04-02 at 21.51.01.png
    Screenshot 2025-04-02 at 21.51.01.png
    12.3 KB · Views: 6
  • Screenshot 2025-04-02 at 21.50.48.png
    Screenshot 2025-04-02 at 21.50.48.png
    1.2 MB · Views: 6
  • Screenshot 2025-04-02 at 21.50.35.png
    Screenshot 2025-04-02 at 21.50.35.png
    464.6 KB · Views: 6
  • Screenshot 2025-04-02 at 21.50.03.png
    Screenshot 2025-04-02 at 21.50.03.png
    1.1 MB · Views: 4
That last screenshot looks really close... I can see them there very tiny so you need to zoom way in and that might force it to load more bars...

Couple thing to try.

It looks like you already figured it out, but make sure that your "Bar Type" is hidden. In my example screenshot there are no "Bars" - Just the profiles.

1743626247240.png

Try and check this box from the main options... This should load a lot faster. This is more of an "estimate" calculated using minute data vs. tick by tick construction of all of these profiles. I would leave it checked until you get everything else figured out.

1743626455457.png

If none of this works, I will ask who your data provider is :)
 
Last edited:
Also one other thing totally off topic, but it will make your life a LOT easier... If you save your charts as analysis files everything will be a lot more organized.

You can go from what you have:

1743626836146.png

To everything being named and categorized by symbol like this:

1743626876787.png

Read my response in this post:

 
That last screenshot looks really close... I can see them there very tiny so you need to zoom way in and that might force it to load more bars...

Couple thing to try.

It looks like you already figured it out, but make sure that your "Bar Type" is hidden. In my example screenshot there are no "Bars" - Just the profiles.

View attachment 2824

Try and check this box from the main options... This should load a lot faster. This is more of an "estimate" calculated using minute data vs. tick by tick construction of all of these profiles. I would leave it checked until you get everything else figured out.

View attachment 2825

If none of this works, I will ask who your data provider is :)
Ye I think it has something to do with the data feed. On my BTC chart my data is from Coinbase (free), but on my stocks its from Yahoo (free).
As you can see it is working better on the stocks with Yahoo, but I still cant understand how to get both monthly/weekly and daily npocs on the same chart? It looks to me you cant adjust what timeframe you want in the settings for imprint? So that I could add three imprint stuides on top of each each other on the same chart and switch timeframe but keeping the weekly, monthly and daily npocs on there?

Also, on the Tesla chart, isnt it possible to get all of the npocs? I mean there is none in the middle bottom big black candle for example, and in total there is only like 11 npocs showing?

Thanks for the workspace cleanup tip, Ill check it out!
 

Attachments

  • Screenshot 2025-04-03 at 20.28.33.png
    Screenshot 2025-04-03 at 20.28.33.png
    362.4 KB · Views: 6
  • Screenshot 2025-04-03 at 20.28.54.png
    Screenshot 2025-04-03 at 20.28.54.png
    815.1 KB · Views: 7
Ye I think it has something to do with the data feed. On my BTC chart my data is from Coinbase (free), but on my stocks its from Yahoo (free).
As you can see it is working better on the stocks with Yahoo, but I still cant understand how to get both monthly/weekly and daily npocs on the same chart? It looks to me you cant adjust what timeframe you want in the settings for imprint? So that I could add three imprint stuides on top of each each other on the same chart and switch timeframe but keeping the weekly, monthly and daily npocs on there?

Also, on the Tesla chart, isnt it possible to get all of the npocs? I mean there is none in the middle bottom big black candle for example, and in total there is only like 11 npocs showing?

Thanks for the workspace cleanup tip, Ill check it out!
I would have to venture a guess that most of these issues are coming down to your data feed & lack of complete data.

I am working with Futures and really only 2 markets (ES & NQ) so my knowledge of your data feed(s) is pretty much nothing.

Since MW is just a piece of software that displays data, I have found in the past if the charts don't seem right, it is the data.

As far as getting weekly and monthly NPoc's on the same chart? I don't think you are going to be able to do that, unless you draw them in by hand. I know in the upcoming release of MW7 you will have that ability since they will be allowing multiple instances of the Volume Imprint study on the same chart.

I wish I was more help! Perhaps someone else with better knowledge of your data feeds will chime in with something :)
 
Top