Max Heap & VRAM

NickMw26

Member
Joined
Oct 10, 2024
Posts
11
Likes
2
Hi all,

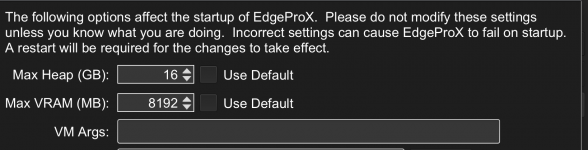
Love Motivewave but get frustrated with the slow load time, especially with volume profiles. I am on a mac studio, 64GB of ram, M2. I recently updated the max heap and vram, to 16GB and 8192, and restarted MW. However, the data load times are still slow and the memory usage is lower than 16 and 8. Is this working as expected, or something else I need to do?

Thanks!
 

Attachments

  • Screenshot 2025-01-04 at 11.23.34 PM.png
    Screenshot 2025-01-04 at 11.23.34 PM.png
    96.2 KB · Views: 17
  • Screenshot 2025-01-04 at 11.24.14 PM.png
    Screenshot 2025-01-04 at 11.24.14 PM.png
    14.6 KB · Views: 18
I don't think tweaking those parameters are helpful. It is all about the amount of data to download and process. The fastest internet connection is a first step, reviewing and tweaking studies used on the chart is the second step. Some studies allows to use minute data instead of tick data that help too.

cheers.
 
I don't have Mac but I know there was issues on Linux whereby the startup script was wrong and it wasn't allowing a full set ot startup parameters to be customisable. I don't know if Mac is suffering from the same problem. I would suspect based on what you presented that something similar is amiss.
 
Interesting. I just noticed I had lost some of my customisations, so anyway, for example if you have that much memory and you have some idea about how much is available then you can customise the startup script and tell the JVM what the minimum startup memory should be. By default it doesn't have any considerations for that so it always starts with a pretty minimal set and then it slowly expands.

So if you figure out where the startup script is (no idea on Mac) then you can make the following change to it to see if it helps:

On the last line of it, on Linux it looks like this:

# Start the JVM. For convenience java has been renamed to motivewave so that is easier to identify in the System Monitor
$SCRIPTDIR/jre/bin/motivewave -Xms2G $MAX_HEAP -Djdk.gtk.version=2 -Dprism.forceGPU=true -Dsun.java2d.opengl=true -Dprism.order=es2,es1,sw,j2d -Dsun.java2d.pmoffscreen=false -Dprism.vsync=false -Dprism.lcdtext=false -Dawt.useSystemAAFontSettings=false $VM_ARGS -javaagent:"$SCRIPTDIR/jar/MotiveWave.jar" -Dname="MotiveWave" -Djava.library.path="$SCRIPTDIR/lib" -DUserHome="$HOME" -Duser.dir="$HOME" -DappDir="$SCRIPTDIR" -DLibraryDirectory="$HOME/Library" -DDocumentsDirectory="$HOME/Documents" -DCachesDirectory="$HOME/Library/Caches" -DDesktopDirectory="$HOME/Desktop" -DDownloadsDirectory="$HOME/Downloads" -DSharedPublicDirectory="$HOME/Public" -Dprism.verbose=true -Dprism.maxvram=$MAX_VRAM -Dglass.gtk.uiScale=$SCALE -Dsun.java2d.uiScale=$SCALE -p "$SCRIPTDIR/javafx" --add-modules=javafx.controls,javafx.base,javafx.graphics,javafx.media,javafx.web,javafx.swing --add-exports javafx.web/com.sun.webkit.network=ALL-UNNAMED -classpath "$CP" MotiveWave
The item in bold is what I've added here: -Xms2G.

If you see some improvement, then based on your machine spec it might be an idea to do something like -Xms8G and then cap the overall at 16G.

With that, just after starting up mine I can see:

1736196346389.png

whereas without it I get:

1736196435379.png

However, I am not doing much here in my MW. However, it's telling that it consumed 277M rather than 115M just on startup, so it must have done a couple of garbage collections just to get here. With something more complex I would assume you'd see a more radical difference.
 
Thanks! Would the minute/tick data option be in each individual study settings, or a general preference?
 
I don't have Mac but I know there was issues on Linux whereby the startup script was wrong and it wasn't allowing a full set ot startup parameters to be customisable. I don't know if Mac is suffering from the same problem. I would suspect based on what you presented that something similar is amiss.
I am actually having a hard time finding the startup.ini file. Is that what you are changing?
 
Don't get confused with the settings. The default parameters are just fine. Studies such TPO, Volume Profile and similar use a lot of tick data to process and draw graphics. They have options to use minute data that speed up the loading without much sacrificing the outcome.
 
Top