I've worked a bit on this setup, and I think it's pretty neat. A candle chart, a heat map, a TPO, and a great DOM all on one page.
Let me know what you think, or if you have specific questions about the setup. I'm on CQG, so you may have to change the symbol if you use Rithmic etc.
Some features:
- Heatmap shows fixed 70 ticks and uses TEN levels of colors making it usable to see patterns and book flips.
- Heatmap uses 1 pixel ticks on 100ms to show 90 second history, trade dot size adjusted like bookmap
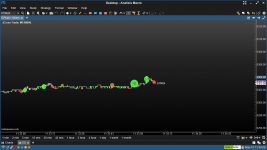
- Candle chart is simple, with VWAP, 21EMA, 50SMA, 200SMA
- Candle chart draws out the 30seconds opening range on the chart
- TPO charts adjusted to show fixed range which shows individual ticks, also adjusted to 11pixel to perfectly match 30m candles
- Because TPO chart perfectly matched the 30m candles, can use 30m moving averages on TPO chart (align letters)
- TPO marks value areas, single prints, and has 100day volume profile
- DOM marks out the 30sec opening range in green and settlement in blue
- DOM has full day volume profile, showing POC and value areas in different color.
Instructions:
Step1: right click on any page tab on the bottom and chose 'Import page'

Step 2: Choose the path where you saved the ES-candle-tpo-heatmap.zip file.
Step 3: Import the page and it should work right away if you are on CQG.
Step 4: (If you are not on CQG), change the symbol of each of the three charts on the page.
PS> You need to have Orderflow version or above. I created this on the Pro version.
Let me know what you think, or if you have specific questions about the setup. I'm on CQG, so you may have to change the symbol if you use Rithmic etc.
Some features:
- Heatmap shows fixed 70 ticks and uses TEN levels of colors making it usable to see patterns and book flips.
- Heatmap uses 1 pixel ticks on 100ms to show 90 second history, trade dot size adjusted like bookmap
- Candle chart is simple, with VWAP, 21EMA, 50SMA, 200SMA
- Candle chart draws out the 30seconds opening range on the chart
- TPO charts adjusted to show fixed range which shows individual ticks, also adjusted to 11pixel to perfectly match 30m candles
- Because TPO chart perfectly matched the 30m candles, can use 30m moving averages on TPO chart (align letters)
- TPO marks value areas, single prints, and has 100day volume profile
- DOM marks out the 30sec opening range in green and settlement in blue
- DOM has full day volume profile, showing POC and value areas in different color.
Instructions:
Step1: right click on any page tab on the bottom and chose 'Import page'
Step 2: Choose the path where you saved the ES-candle-tpo-heatmap.zip file.
Step 3: Import the page and it should work right away if you are on CQG.
Step 4: (If you are not on CQG), change the symbol of each of the three charts on the page.
PS> You need to have Orderflow version or above. I created this on the Pro version.
Attachments
Last edited: