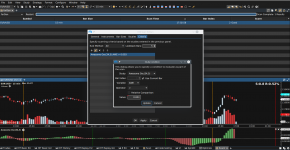
Study Scan

Indyan

Active member
Joined
Jan 5, 2021
Posts
34
Likes
5
I am trying to scan rsidiv but its not showing any result. i want to get scan result for different timeframe of my watchlist. also same with macd signal scan. or trendline breakout scan... I might be missing something which i need to change/edit in study scan?
Also i tried custom column and added rsidiv in watchlist, it gave alert but i want it to be use as scan as we scan ew or harmonics.

Ant guidance will be highly appreciated.
Thanks
 
Last edited:
scan issue resolved by choosing "one or more"

Now i am thinking to plot auto harmonic on rsi. is this possible? i tried overlay on rsi and applied auto harmonic but its not working , can anyone please help.
i need to make scan alert for 2week high low breakout which we can make from support resistance but this s/r should be broken with volume more than 2.5x volume in last 50 candles. i am not able to made this volume part. sma on volume would do it but how i can make to scan? please help

Thanks.
 
Last edited:
Hello @Indyan and thank you for your question.

The scanner can only scan for predefined values, and they need to be 'coded' into the Study you're using to scan.

For instance: I can scan the Awesome Oscillator for it's value (called 'AWE') and have it return a positive scan result (or a 'hit' so you will) when this value reaches above / below a certain treshold. I used 'above 0.003' in the example below:


1626707044320.png


If you want a certain Study to make 'more complicated' scans (using part of the Study as import, running calculations on it, and use the end result as a treshold for hit or miss), you would need to custom-code that Study by making use of MW's SDK.

There are a bunch of threads on this forum on how to set up your Development Environment and get started with the SDK.
I suggest you start here: Spin's Ultimate IntelliJ Setup Thread

Another suggestion would be to contact a MW-custom-programmer. I am such a person :)
 
Top