This is my first attempt at developing on MW, although I have a fair bit of experience on several other platforms.
I have a chart, say 4H, and I would like to plot the EMA calculated on a different bar size, specified by the user, for example 1H.
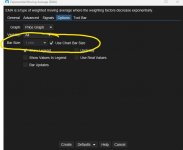
I have managed to get the input settings working so I can specify the period and bar size for the EMA.
I have also fetched a data series for that bar size, and it does seem to have data.
I'm a bit stumped on how to index into the data-series for the other bar-size during the calculate() method, which is based on the chart's bar size,
so presumably the chart's index parameter is useless to me here.
I can get something plotting, but the values are way off when I compare them to TradingView, so I must be indexing incorrectly into the other data series.
Has anyone else had any experience with this?
int emaPeriod = getSettings().getInteger(EMA_PERIOD);
BarSize emaBarSize = getSettings().getBarSize(EMA_BAR_SIZE);
var emaBars = ctx.getDataSeries(emaBarSize);
if (emaBars != null)
{
var emaValue = emaBars.ema(index, emaPeriod, Enums.BarInput.CLOSE); // PROBABLY WRONG!!! - How do I know what index to use with the emaBars data series?
series.setDouble(index, Values.EMA, emaValue);
}

