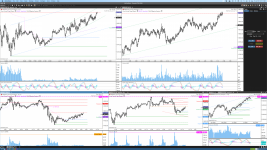
How does one setup two charts for the same symbol different timeframe and studies, and have both charts linked to the watchlist?
Chart 1: Symbol AAA, 1 minute, has some studies, link group red.
Chart 2: Same symbol AAA, 5 minute, different studies, link group red.
When I click a symbol in the watchlist, both charts update to the same new symbol - this works.
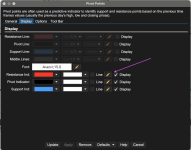
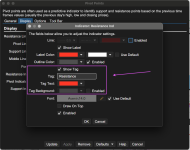
But if I change the studies on chart 2, then they also change on chart 1. I want the studies to be different.
Tried using chart templates, but couldn't get it to work. This should be simple, but can't figure this out. Any help appreciated!
Chart 1: Symbol AAA, 1 minute, has some studies, link group red.
Chart 2: Same symbol AAA, 5 minute, different studies, link group red.
When I click a symbol in the watchlist, both charts update to the same new symbol - this works.
But if I change the studies on chart 2, then they also change on chart 1. I want the studies to be different.
Tried using chart templates, but couldn't get it to work. This should be simple, but can't figure this out. Any help appreciated!