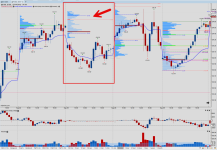
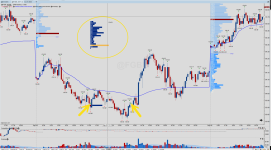
Seems to be a data quality issue (I use Rithmic). The problem does not occur as soon as I switch to historical minute bars. The TPO profile chart was the only chart showing volume data at the right place/area, and it uses (if I'm not wrong, historical minute bars for the volume profile). All other charts where the "Volume Imprint" study is added for showing the VP are facing the same issue (standard charts, time based, tick based, footprint with all variations of enabled/disabled column 1 and 2, etc.). But yes, you are right with your first hint, the trading hours can cause similar issues, but actually not in this case. Changing from the continuous contract directly to the front month did not help in my case. Cleaning local data etc. was also not helping. My workaround will be to add a volume profile for such days and turn on the historical minute bars. I've checked the last recent history, it also occurred 2 times in June.


