You are using an out of date browser. It may not display this or other websites correctly.
You should upgrade or use an alternative browser.
You should upgrade or use an alternative browser.
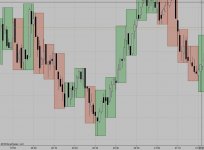
Outline of a 5 minute candle in the 1 minute chart
- Thread starter samy2006
- Start date
ScottyA
Well-known member
- Joined
- Aug 1, 2019
- Posts
- 276
- Likes
- 198
Is there a way to display, for example, a 5 minute candle in a 1 minute chart? After five one-minute candles, an outline is created that represents a finished 5-minute candle.
Unfortunately not.
This idea is genius! In fact, I thought it "could" be the next evolution in charting. I have a fairly robust concept drawn up too!
Spin
Well-known member
- Joined
- May 22, 2019
- Posts
- 510
- Likes
- 219
I've been working on a little something to show my appreciation for the MW-community:

Allow me a couple of days to fine-tune this Study. I will then make it publicly available.
EDIT: yes, I saw the copy/paste-mistake in the Study's description (in the menu window)
")
Allow me a couple of days to fine-tune this Study. I will then make it publicly available.
EDIT: yes, I saw the copy/paste-mistake in the Study's description (in the menu window)
Spin
Well-known member
- Joined
- May 22, 2019
- Posts
- 510
- Likes
- 219
Curious about that 'robust concept' nowUnfortunately not.
This idea is genius! In fact, I thought it "could" be the next evolution in charting. I have a fairly robust concept drawn up too!
")
Spin
Well-known member
- Joined
- May 22, 2019
- Posts
- 510
- Likes
- 219
Finally came around to finishing this
Get MetaBars_V1 here
Use this code to get it for free:
PartOfTheMWForumCrew
[on a sidenote: I made the download available over my SendOwl-page, because I would like to know how many traders want to use this Study. It's a small experiment of mine to see how 'big' the market on the MW-Forums is. Feel free to use a fake email-address ! ]
]
You will download a .zip file, containing
It seems to perform well with smaller timeframes, but once above H4 I see 'overlaps', due to start/end-of-day- issues.
Feedback & suggestions welcome
Get MetaBars_V1 here
Use this code to get it for free:
PartOfTheMWForumCrew
[on a sidenote: I made the download available over my SendOwl-page, because I would like to know how many traders want to use this Study. It's a small experiment of mine to see how 'big' the market on the MW-Forums is. Feel free to use a fake email-address !
]You will download a .zip file, containing
- the .java source code that you can fiddle with
- and a .jar that you can import directly into MW by going to Menu > Study > All Studies > Import
It seems to perform well with smaller timeframes, but once above H4 I see 'overlaps', due to start/end-of-day- issues.
Feedback & suggestions welcome
Last edited:
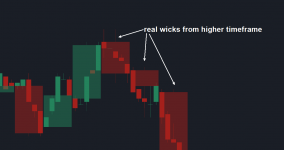
thank you for this great work. The problem with the overlaps is annoying. these overlaps unfortunately also exist on the smaller timefrime (1min):

Another problem.....i tried this indicator on volume imprint and the start candle could not be detected correctly. Then I went into the settings of Volume Imprint and set "start often bar" under Align and then everything was displayed correctly.
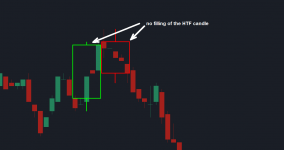
the 2nd problem is that some places are not filled in:

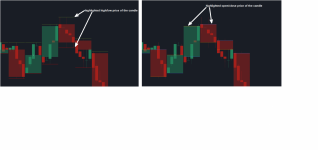
following suggestions are more or less gimmicks but if you are interested I have the following suggestions (useful find the display of the wicks and the not filled candle):
Another problem.....i tried this indicator on volume imprint and the start candle could not be detected correctly. Then I went into the settings of Volume Imprint and set "start often bar" under Align and then everything was displayed correctly.
the 2nd problem is that some places are not filled in:
following suggestions are more or less gimmicks but if you are interested I have the following suggestions (useful find the display of the wicks and the not filled candle):
Attachments
Last edited:
ScottyA
Well-known member
- Joined
- Aug 1, 2019
- Posts
- 276
- Likes
- 198
You are a generous man! Thank you much.
I know I promised you a batch of code, but life has been so full lately! My apologies. I haven't forgotten.
designer01
Member
- Joined
- Aug 19, 2019
- Posts
- 12
- Likes
- 6
Spin, Thanks for posting this indicator works great!!
Similar threads
- Replies
- 4
- Views
- 798
- Replies
- 6
- Views
- 687
- Replies
- 1
- Views
- 294