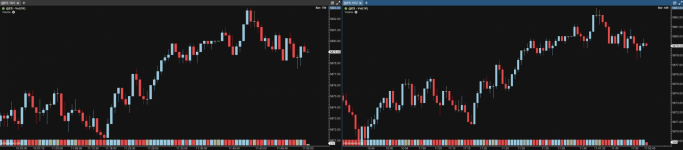
I’m hoping to get some insights into why my two volume interval charts for the ES futures contract, both set to 1K volume per bar, are displaying differently. I’ve attached a screenshot showing the charts side by side. As you can see, even though both charts are set to a volume interval of 1K, the candlestick patterns, bar counts, and timestamps don't align. I am using a CQG data feed.
Some questions I have:
1. Is it possible there are discrepancies in how MotiveWave handles volume or time synchronization, even with the same volume interval setting?
2. How can I establish the "ground truth" of what a volume chart should look like, especially when the charts aren’t repeatable across setups?
3. Am I missing something when setting up the chart (The restart daily box is checked)?
Any insights or explanations would be appreciated.
Thanks in advance for your help!