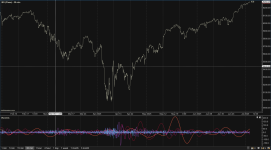
For anyone wondering, this is a high-level from Claude AI:
What are Wavelets?
Wavelets are mathematical functions that decompose time series data into different frequency components, each with a resolution matched to its
scale. Unlike Fourier transforms, wavelets are localized in both time and frequency, making them ideal for analyzing non-stationary financial
data.
Key Trading Applications:
1. Multi-Resolution Analysis
- Decomposes price into different time scales (D1-D7 in your code)
- D1: High-frequency noise (shortest cycles)
- D7: Low-frequency trends (longest cycles)
- Each level represents roughly double the period of the previous
2. Noise Filtering
- Separates market noise from underlying trends
- Higher decomposition levels (D5-D7) reveal cleaner trend signals
- Lower levels (D1-D3) often contain market microstructure noise
3. Cycle Detection
- Identifies dominant market cycles at different timeframes
- Helps traders align with the prevailing rhythm of the market
- Your auto-scaling targets ~390 minute sessions (typical trading day)
4. Support/Resistance Levels
- Wavelet coefficients can identify price levels where trends change
- Zero-crossings in detail coefficients often coincide with turning points
5. Volatility Analysis
- Energy at different scales indicates volatility regimes
- Sudden changes in wavelet coefficients signal regime shifts

