Hi folks,
I'm new to MW and trying to recreate this TradingView chart.
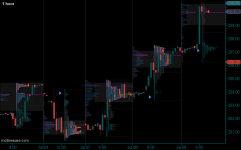
It is showing 1H bars, with the VP going from session open (6pm) to the next session open.
I have played around with the VP in MW and it just seems to show 1 VP stuck to the left/right edge of the chart.
Anyone know if its possible to achieve the layout below in MW?
Thanks in advance for any help,
Charlie

I'm new to MW and trying to recreate this TradingView chart.
It is showing 1H bars, with the VP going from session open (6pm) to the next session open.
I have played around with the VP in MW and it just seems to show 1 VP stuck to the left/right edge of the chart.
Anyone know if its possible to achieve the layout below in MW?
Thanks in advance for any help,
Charlie
Last edited:
")